How to Track PDF Engagement with Google Analytics
Understanding how readers interact with your content can be challenging. After you publish a PDF or flipbook, it is hard to know which pages are viewed, how long users stay, and where they lose interest.
FlowPaper helps solve this by allowing you to connect your publication to Google Analytics and track reader behavior in detail.
![]()
Enable Google Analytics tracking in FlowPaper
To start tracking, open the publication you want to connect to Google Analytics.
In the left toolbar, go to Settings, find the Google Analytics / Tag Manager ID field, and paste your tracking ID from your Google Analytics account. Then click Apply Settings.
After adding your tracking ID, you’ll need to republish your publication for the changes to take effect (Publish → Cloud Hosted → Start Upload). Tracking will start once your updated publication is live.
View publication statistics in Google Analytics
Once your publication is live, open your Google Analytics account to monitor performance.
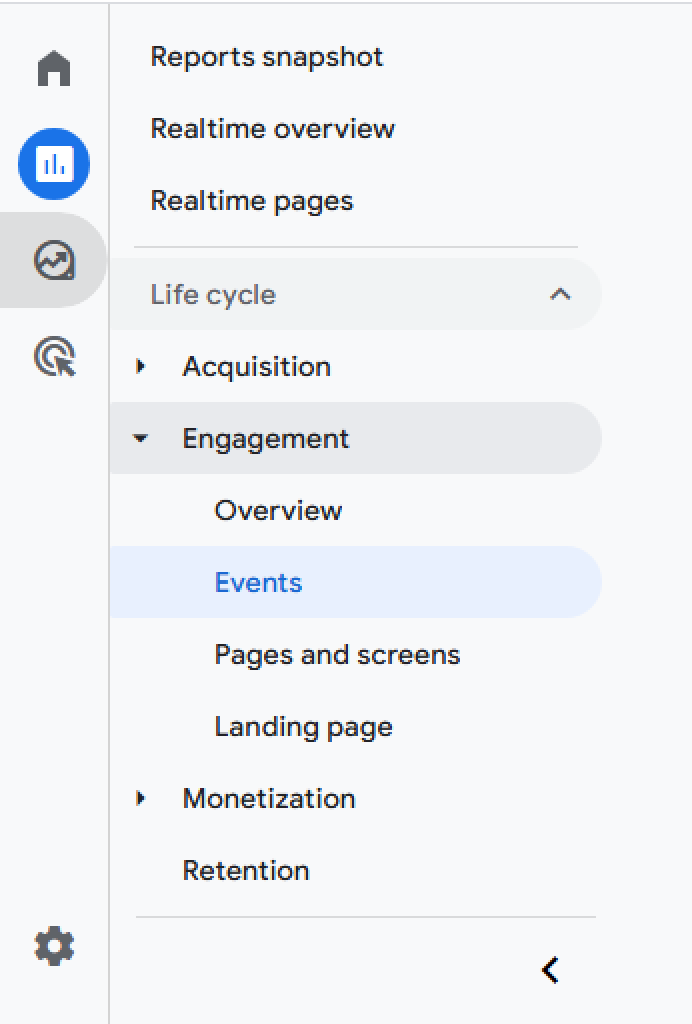
In Google Analytics 4 (GA4), you can explore engagement data under the Reports section, particularly in areas related to user interaction and events.
Here you can analyze how readers interact with your publication, including:
-
which pages get the most views
-
how users navigate through the document
-
how much time they spend engaging with your content
This data can help you understand what content performs best and where readers may drop off, allowing you to improve your publications over time.
Explore more analytics options
In addition to Google Analytics, FlowPaper also provides built-in tools to analyze reader behavior.
Learn more in:
Understand Reader Behavior Using Heatmaps