PDF Analytics and Reader Tracking: Measure Engagement in Your Flipbooks
Most PDFs are shared without any clear understanding of how they perform. You don’t know who opened them, how long they were read, or which pages actually mattered.
FlowPaper provides built-in PDF analytics and reader tracking, so you can measure engagement directly inside your publications — without external tools.
For example, a product catalog can show which pages get the most attention before a purchase, while a sales presentation can reveal where readers lose interest.
What you can track in your PDF


Once your publication is live, FlowPaper automatically collects data about how readers interact with it. You can quickly understand performance through key metrics:
-
Unique sessions and total views — how often your document is opened
-
Average read time — whether users actually read or just skim
-
External link clicks — how often readers move to your website or landing pages
You can also go deeper with page-level analytics, where you see views, time spent, and interactions for each page — helping you identify which content holds attention and which may need improvement.
Heatmaps: see where readers focus
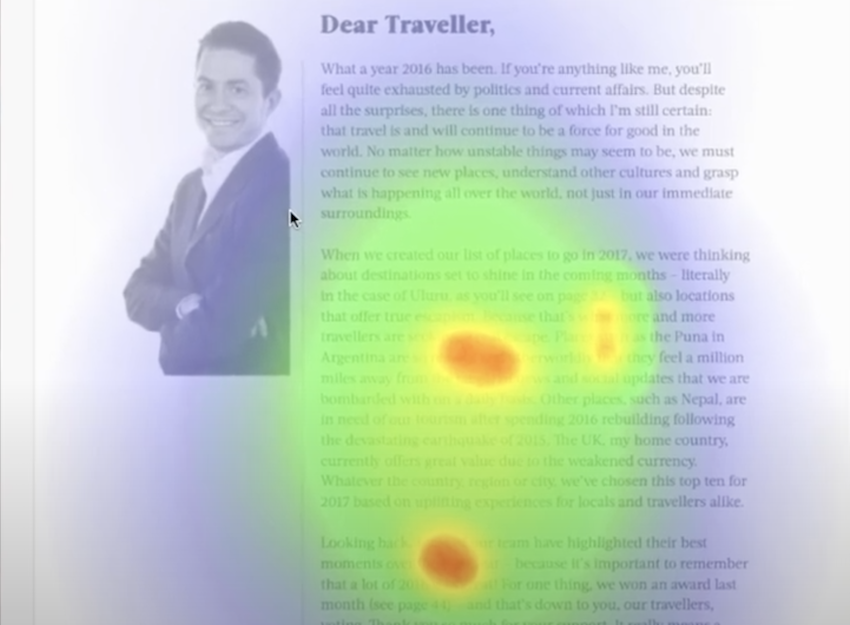
While traditional metrics show what happens (for example, how long a page was viewed), heatmaps show how readers interact with the content. They use color-coded overlays to highlight where users click, zoom, or focus their attention on each page.
This is especially useful for understanding layout effectiveness. For example, you can see if users focus on product details, ignore key sections, or interact with specific elements more than expected.
How to enable analytics and heatmaps
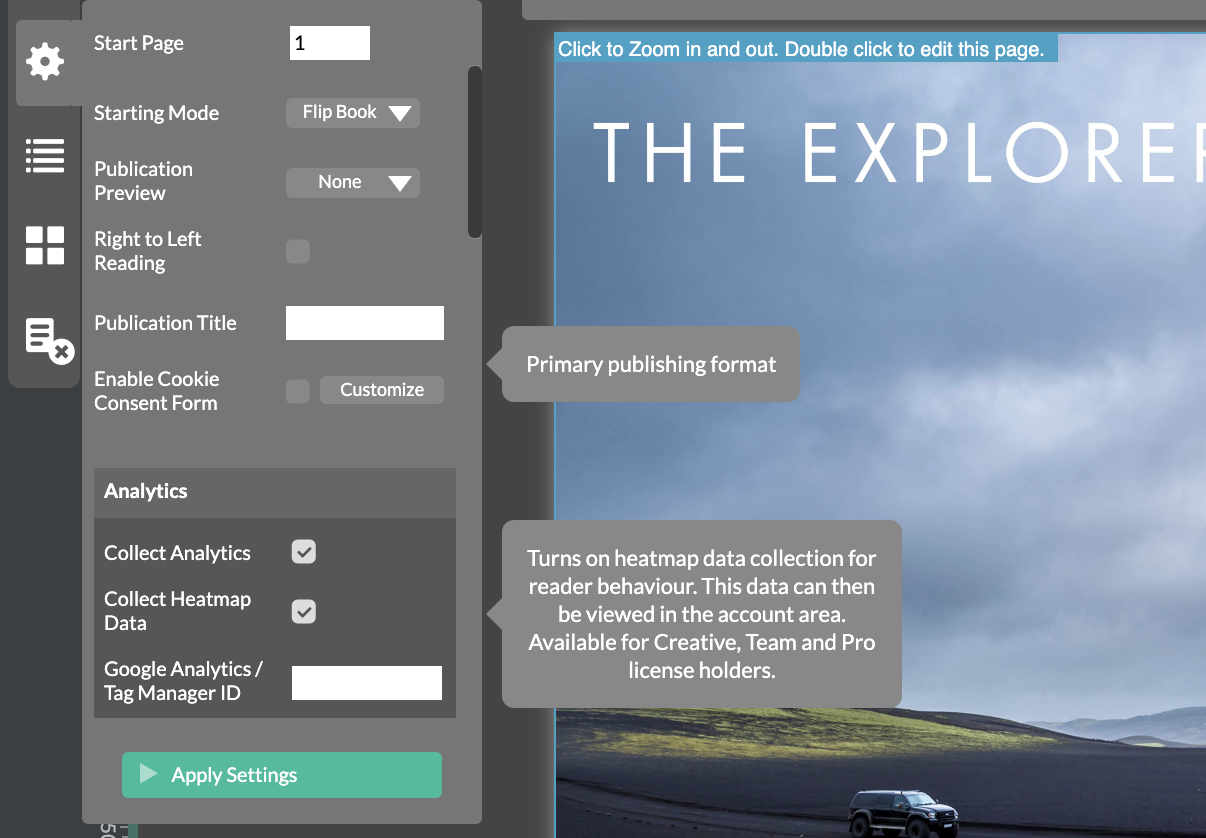
To start collecting data, open your PDF in FlowPaper and go to Settings in the left toolbar.
In the Analytics section, enable:
-
Collect Analytics
-
Collect Heatmap Data
Click Apply Settings, then publish your document. Data will start collecting once the publication is live and readers begin interacting with it.
Where to view your analytics

To access analytics, open the Account Area from the top-right corner of the dashboard.
Go to your publications list and find the relevant document. Next to it, select View Analytics or View Heatmaps.
Read next
Improve the Search Ranking of Your PDFs